


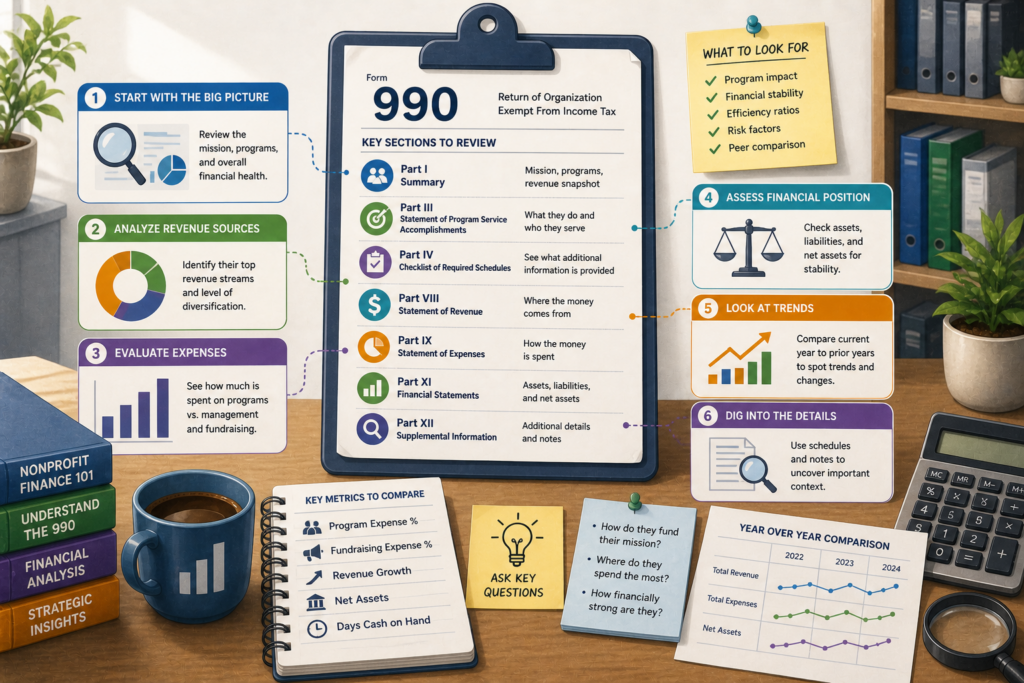
Nonprofit financial statements tell a story, but on their own, they’re incomplete. A single organization’s numbers don’t mean much until you place them next to a peer. That’s where a competitor’s Form 990 becomes one of the most powerful benchmarking tools available.
For CFOs, controllers, and finance leaders, Form 990 is a standardized, IRS-validated dataset that reveals how similar organizations generate revenue, allocate resources, and structure operations. When read correctly, it transforms public information into board-level insight.
This guide shows you how to use a competitor’s 990 to interpret nonprofit financial statements, calculate meaningful benchmarks, and identify where your organization is outperforming or falling behind.
TL;DR
- Use nonprofit financial statements to uncover how peers generate revenue, allocate funds, and scale operations.
- Compare program ratios, fundraising efficiency, and revenue concentration to identify strengths and risk gaps.
- High dependence on a single funding source, rising overhead, or shrinking margins signal issues before they become visible internally.
- One year of data isn’t enough; true nonprofit peer comparison comes from trends and normalized ratios.
- Tools like Crowded give real-time financial visibility, so you’re not waiting for next year’s 990 to understand today’s performance.
Why Form 990 Is Central to Nonprofit Financial Statements
Form 990 is one of the most detailed and consistent sets of publicly available nonprofit financial statements. Unlike internal reports, it follows a standardized format across all tax-exempt organizations, enabling direct comparisons.
Each filing answers three critical questions:
- Revenue mix: Where does funding come from?
- Expense allocation: How are resources distributed?
- Leadership structure: How is compensation aligned with scale?
This consistency makes Form 990 benchmarking a practical method for comparing nonprofit peers using reliable public information.
Instead of guessing how similar organizations operate, you can see it directly, line by line.
How to Read Nonprofit Financial Statements from a Competitor’s 990
Use this step-by-step process to extract meaningful insights from a peer organization’s filing.
1. Start with Part I: Financial Snapshot
Focus on:
- Total revenue
- Total expenses
- Net assets
This establishes scale, growth trajectory, and financial stability across comparable organizations.
2. Break Down Revenue Mix (Part VIII)
Review:
- Contributions and grants
- Program service revenue
- Investment income
What to assess:
- Diversification vs. dependency
- Stability of funding sources
Example insight: An organization with 70% grant funding may face more volatility than one with balanced income streams.
3. Evaluate Functional Expenses (Part IX)
Key categories:
- Program services
- Management & general
- Fundraising
What it reveals:
- Mission focus vs. operational overhead
- Investment in infrastructure vs. direct impact
4. Analyze Executive Compensation (Part VII)
Compare:
- Executive Director/CEO salary
- Key employee compensation
Always evaluate compensation relative to total revenue and organizational complexity.
5. Assess Balance Sheet Strength (Part X)
Look at:
- Cash reserves
- Liabilities
- Net assets
Strong balance sheets indicate resilience; weak liquidity may point to operational risk.
6. Review Public Support (Schedule A)
Focus on:
- Percentage of public support
- Funding concentration
This determines sustainability and compliance risk over time.
7. Read Narrative Disclosures (Schedule O)
Identify:
- Strategic changes
- One-time financial events
- Program expansions
Provides context behind unusual numbers in nonprofit financial statements.
Key Nonprofit Financial Ratios for Benchmarking
When comparing nonprofit financial statements, ratios matter more than raw totals. Use these nonprofit financial ratios for consistent analysis:
Program Expense Ratio
Formula: Program Expenses ÷ Total Expenses
Purpose: Measures how much funding supports mission-related work
Administrative Ratio
Formula: Management & General ÷ Total Expenses
Purpose: Indicates operational overhead
Fundraising Efficiency
Formula: Contributions ÷ Fundraising Expenses
Purpose: Shows return on fundraising investment
Operating Margin
Formula: (Revenue – Expenses) ÷ Revenue
Purpose: Tracks surplus or deficit trends
Revenue Concentration Ratio
Formula: Largest Revenue Source ÷ Total Revenue
Purpose: Identifies dependency risk
Example: Benchmarking Two Nonprofit Financial Statements
Below is a simplified nonprofit peer comparison based on Form 990 data:
Metric | Nonprofit A | Nonprofit B |
Total Revenue | $5M | $5.2M |
Program Expense Ratio | 82% | 68% |
Admin Ratio | 10% | 20% |
Fundraising Efficiency | 4.5x | 2.8x |
Operating Margin | +6% | -2% |
Revenue Concentration | 35% | 70% |
Key insights:
- Nonprofit A demonstrates stronger mission alignment and financial efficiency.
- Nonprofit B shows higher overhead and reliance on a single revenue stream
This is the practical value of Form 990 benchmarking, turning nonprofit financial statements into actionable comparisons.
From Static Nonprofit Financial Statements to Real-Time Financial Visibility
Traditional nonprofit financial statements, including Form 990, are inherently backward-looking. By the time you analyze them, the financial reality has already changed.
That creates a gap between:
- When decisions are made
- When insights become available
Modern financial platforms like Crowded close that gap by moving organizations from static reporting to continuous visibility.
Instead of relying solely on annual filings, finance teams can:
- Track multi-entity finances in real time, especially for chapter-based organizations
- Categorize transactions in alignment with 990 reporting, reducing year-end cleanup
- Monitor revenue and expenses continuously
This transforms benchmarking from a once-a-year exercise into an ongoing strategic advantage. You’re no longer reacting to outdated nonprofit financial statements; you’re operating with live financial intelligence.
Common Mistakes When Comparing Nonprofit Financial Statements
Avoid these pitfalls when conducting nonprofit peer comparison:
- Comparing organizations without adjusting for size or revenue scale
- Ignoring differences in revenue models (grants vs. earned income)
- Over-relying on a single ratio without context
- Analyzing only one year instead of multi-year trends
Benchmarking only works when comparisons are consistent and contextual.
Final Takeaway
Understanding nonprofit financial statements is about interpreting strategy.
A competitor’s Form 990 gives you a standardized lens into how peer organizations operate, allocate resources, and sustain growth. When combined with structured ratios and consistent comparisons, it becomes a powerful benchmarking tool.
And when you layer that insight with real-time financial visibility, you move beyond static reporting into proactive financial leadership, where decisions are informed, timely, and strategically grounded.
Frequently Asked Questions
Can Form 990 data help identify operational inefficiencies beyond expense ratios?
Yes. By comparing trends across multiple years, such as rising admin costs without proportional revenue growth, you can spot inefficiencies that aren’t obvious in a single-year view. Pairing this with real-time tracking tools like Crowded allows you to catch these patterns before they show up in future filings.
How do multi-chapter or federated nonprofits benchmark effectively using Form 990?
Benchmarking becomes more complex when multiple entities operate under one structure. You need to compare both consolidated and entity-level data. Platforms like Crowded simplify this by giving finance teams visibility across chapters while aligning categorization with 990 reporting structures.
What should I do if competitor data looks inconsistent or incomplete?
Treat Form 990 as a starting point. Supplement it with annual reports, audits, and public disclosures. Internally, maintaining clean, consistently categorized financial data, such as through systems like Crowded, ensures your own reporting is reliable and audit-ready.
How can benchmarking improve board reporting and decision-making?
Benchmarking adds context to your numbers. Instead of reporting isolated figures, you can show how your organization performs relative to peers. This strengthens board discussions and supports more strategic decisions, especially when paired with real-time financial visibility rather than static, year-end data.
Is it possible to automate parts of the 990 benchmarking process?
Yes. While pulling 990 data is manual, internal benchmarking can be automated through systems that standardize categorization and reporting. Crowded, for example, structures financial data in a way that aligns with IRS reporting, making it easier to compare performance continuously instead of rebuilding analyses each year.